
Oceanía/Australia/Diciembre del 2017/https://theconversation.com
Today’s release of the 2017 NAPLAN National Report confirms preliminary findings released in August and offers deeper insights into achievement trends since the assessment program began a decade ago.
The results paint an overall portrait of plateauing student achievement in literacy and numeracy, mixed with pockets of improvement and persistent inequalities between young people from different backgrounds.
High level trends over the past decade
NAPLAN takes place annually. It assesses Australian school students in years three, five, seven and nine across four domains: reading, writing, language conventions (spelling, and grammar and punctuation), and numeracy.
Nationally, NAPLAN results have flat-lined in most areas since testing was first conducted in 2008. There are no statistically significant differences in achievement across the majority of domains and year levels.
Read more: NAPLAN is ten years old – so how is the nation faring?
Improvements can be seen in a limited number of domains and year levels. There are statistically significant increases in spelling (years three and five), reading (years three and five), numeracy (year five), and grammar and punctuation (year three).

Year seven writing is the only area to show a statistically significant decline. It remains a major area of concern.
State and territory comparisons reveal good news for Queensland and Western Australia. Both show improvements across a number of domains and year levels.
New South Wales, Victoria and the Australian Capital Territory show high achievement, but results have plateaued.
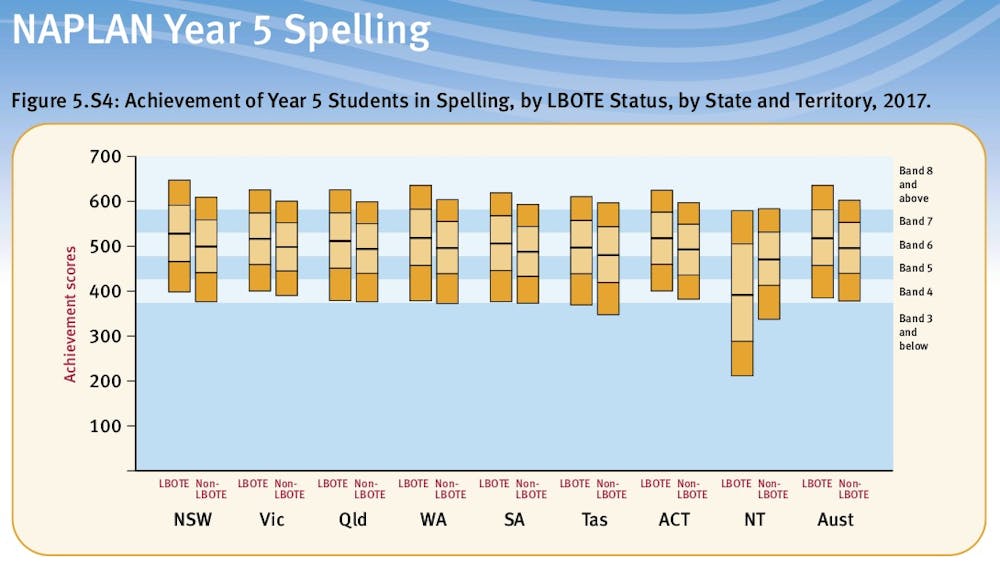
The Northern Territory continues to lag significantly behind the rest of the nation across all domains and year levels.
The vast majority of young people meet the National Minimum Standards (NMS). NMS provide a measure of how many students are performing above or below the minimum expected level for their age across the domains.
NMS percentages are over 90% for the majority of domains and year levels. But NMS percentages vary widely. For example, only 55.7% of students in the Northern Territory meet the NMS for year seven writing, compared to 90.8% in Victoria.
Background affects achievement
This year’s results show clear patterns of achievement between young people from different backgrounds. In many cases, these differences reflect broader inequalities in Australian society.
Notable trends include:
- gender differences are persistent. Female students perform significantly better than male students in writing, and grammar and punctuation across all year levels. For example, 88.1% of female students meet the NMS for year nine writing, compared to 75.4% of male students
- students with a language background other than English (LBOTE) performed significantly better in spelling than non-LBOTE students across all year levels. LBOTE students have also shown gains since 2008 in reading (years three and five), grammar and punctuation (years three and seven), spelling (years three and five) and numeracy (year five)
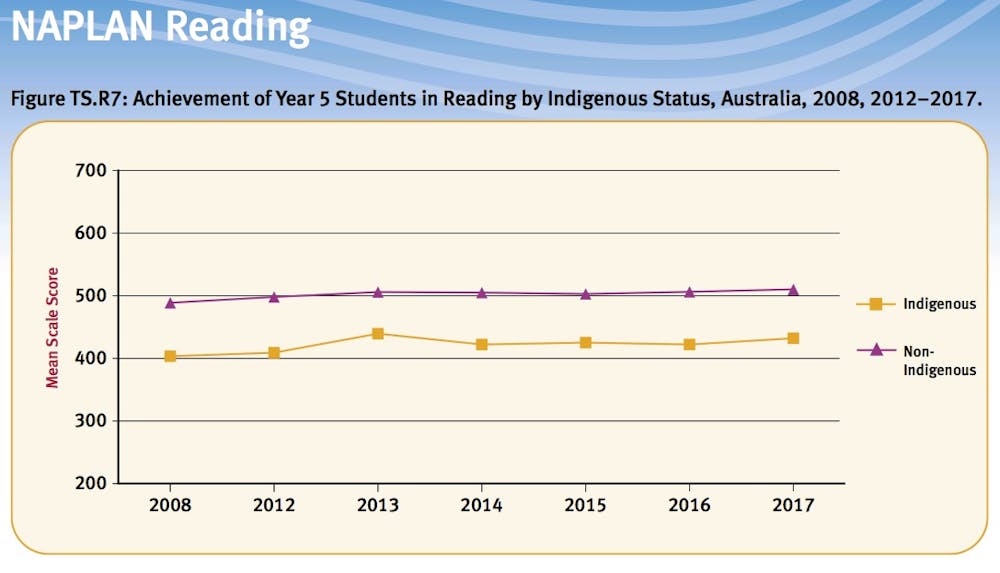
- Indigenous students have shown statistically significant gains since 2008 in reading (years three and five), spelling (years three and five), grammar and punctuation (years three and seven) and numeracy (years five and nine). But Indigenous students still trail significantly behind non-Indigenous students across all domains and years levels
- parental education is a key factor determining student achievement. For example, in year three grammar and punctuation, the mean scale score for a young person whose parents have a Bachelor degree or above is 479.7, compared to 369.6 for students whose parents have a Year 11 equivalent or below. Similar patterns are reflected across all domains and year levels
- geographical location also has a major bearing on student achievement. For example, in year three grammar and punctuation, the mean scale score for young people in major cities was 450, compared to 284.6 for young people from very remote and 411.5 for outer regional locations.
As always, tread cautiously with data
NAPLAN is one useful measure of student achievement in Australian schooling.
When interpreted carefully, it can help policy makers, researchers, school leaders, teachers, students and parents better understand and debate literacy and numeracy achievements. It also serves to highlight pockets of underachievement and disadvantage, and can play an important role informing policy interventions and investments.
Read more: Evidence-based education needs standardised assessment
But NAPLAN is not an oracle and can only tell us so much. So we should treat these results carefully.
To get a more accurate picture of achievement trends, we need to take a number of indicators into consideration. This should go beyond the basics of literacy and numeracy, including achievements in ATAR subjects, year 12 attainment rates, and more.
NAPLAN results should also be considered in relation to other standardised assessments, which do not always tell the same story.
For example, the latest Progress in International Reading Literacy Study (PIRLS) suggest reading achievement among Australian children has improved significantly, whereas the OECD’s Programme for International Student Assessment (PISA) shows steadily declining Australian results in all areas, including reading.
It’s also important to analyse school and student level NAPLAN data, which will be released in March 2018. It will no doubt lead to another round of debates about the role of NAPLAN in our schools.
Fuente:
https://theconversation.com/naplan-2017-results-have-largely-flat-lined-and-patterns-of-inequality-continue-88132
Fuente Imagen: https://lh3.googleusercontent.com/Nrc1tCbuLew0bcSfJHcRtqiLgR64N4zyqP1PCV8oJ4kxIrvTh4VXCXAlG-akl-zAfD2BkQ=s124


 Users Today : 37
 Total Users : 35460300
 Views Today : 54
 Total views : 3419022